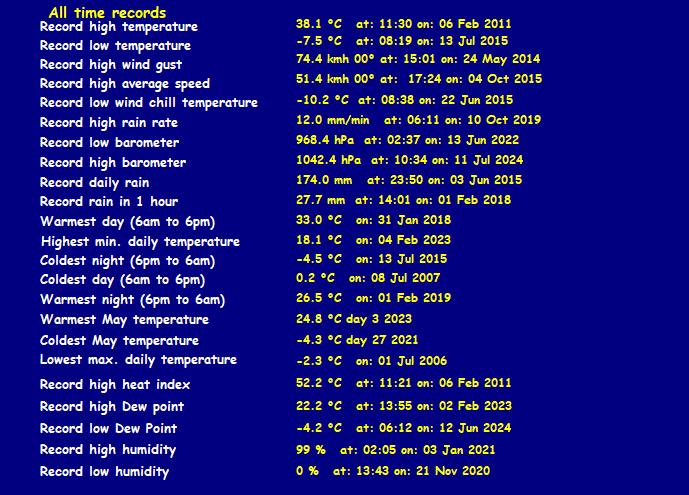
| Fairfield Dunedin Weather | |||
|---|---|---|---|
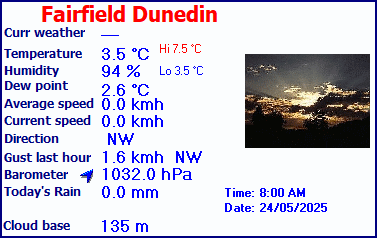
| LAST READING AT TIME: 3:00 AM DATE: 12 January 2026, time of next update: 3:15 am | |||
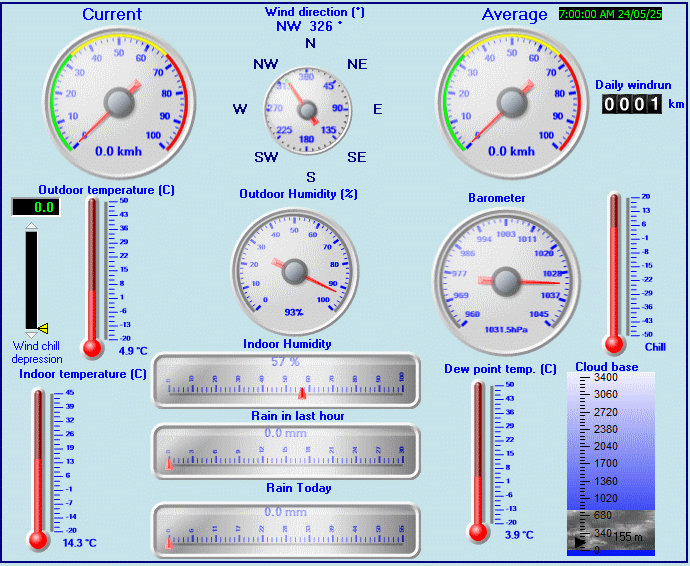
| Current Weather | ---/Night | Current Temperature | 10.6°C (51.1°F), Apparent temp 10.0°C |
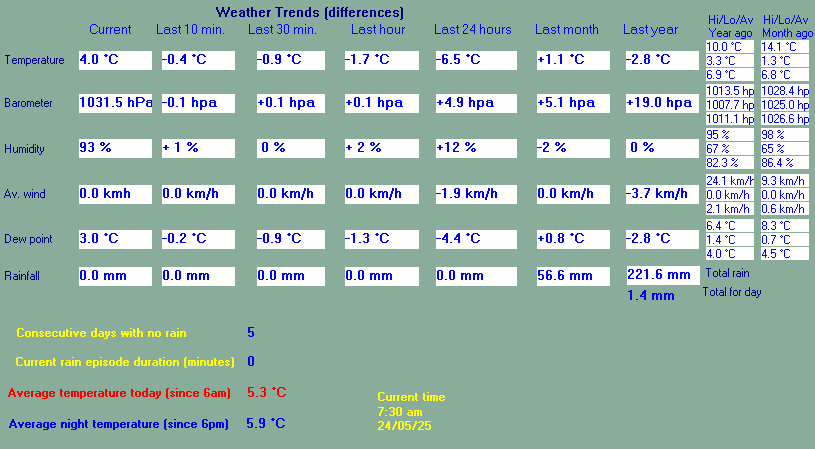
| Maximum Temperature (since midnight) | 11.5°C at: 1:11 AM | Minimum Temperature (since midnight) | 10.6°C at: 2:49 AM |
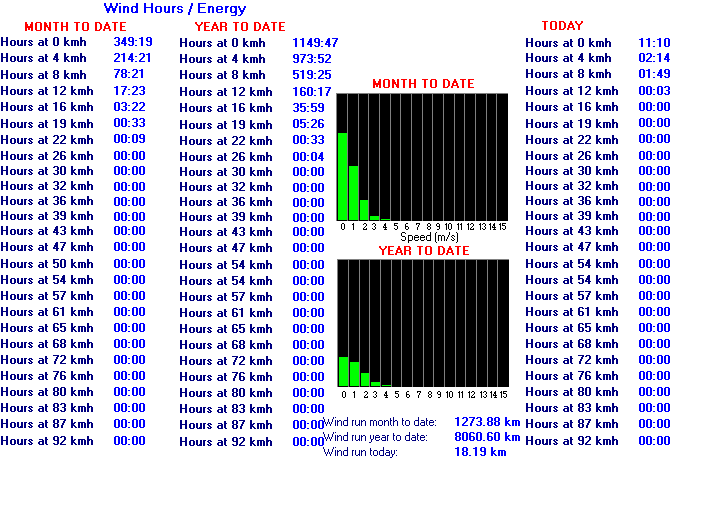
| Average windspeed (ten minute) | 2.2 kmh (1.2 kts) | Wind Direction (ten minute) | WNW (291°) |
| Windchill Temperature | 10.6°C | Maximum Gust (last hour) | 30.6 kmh (16.5 kts) at: 2:03 AM |
| Maximum Gust (since midnight) | 31.5 kmh (17.0 kts) at: 2:03 AM | Maximum 1 minute average (since midnight) | 13.8 kmh (7.4 kts) at: 2:04 AM |
| Rainfall (last hour) | 0.0 mm | Rainfall (since midnight) | 0.0 mm (0.00 in.)--- |
| Rainfall This month | 19.6 mm (0.77 in.) | Rainfall To date this year | 19.6 mm (0.77 in.) |
| Maximum rain per minute (last hour) | 0.0 mm/min | Maximum rain per hour (last 6 hours) | 0.0 mm/hour |
| Yesterdays rainfall | 0.2 mm | DewPoint | 6.6°C (Wet Bulb :8.7°C ) |
| Humidity | 76 %, Humidex 10.5°C | Barometer corrected to msl | 1005.5 hPa |
| Pressure change | +1.1 hPa (last hour) | Trend (last hour) | RISING SLOWLY |
| Pressure change (last 12 hours) | +12.6 hPa | Pressure change (last 6 hours) | +6.5 hPa |
| Current Indoor Temp. 21.1°C | |||
| Current Indoor Hum. 46% | |||
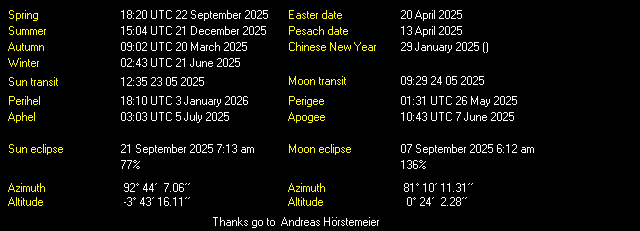
Use the RELOAD facility on your browser to retrieve the latest data.